


Meet the only AI assistant built for data. Analyze, document, and answer any data question — fast.
 Learn more
Data engineering is no longer just about moving data from point A to point B. As organizations mature, data engineers are increasingly responsible for owning quality, defining metrics, managing complexity, and bridging the gap between technical systems and business context. The role has become central to how teams collaborate, make decisions, and build trust in their data.
In this guide, we’ve curated a list of 27 data engineering tools that are shaping how teams work in 2025. From core infrastructure like Snowflake and dbt to emerging platforms like Apache Flink, lakeFS, and Hex, each tool represents a building block in the modern data stack. These recommendations are based on conversations with over 150 data engineers, Reddit and community trends, and firsthand insights from fast-growing teams.
Throughout this post, we’ll explore:
- Which tools are being adopted most by mid-sized tech companies
- How data teams are balancing batch and real-time needs
- What’s driving interest in versioning, observability, and semantic modeling
- Why solving the communication gap is becoming just as important as building pipelines
- How platforms like Secoda are helping data engineers scale knowledge and quality across the business
Whether you’re building your first stack or evolving a mature one, this guide is built to help you navigate the ecosystem, make smarter decisions, and stay ahead of what’s next in data engineering.
Cloud warehouses & lakehouses
Modern data engineering starts with a reliable, scalable storage layer. Cloud data warehouses and lakehouses offer elastic compute, high concurrency, and seamless integrations with BI and ML tools. Here are the most popular storage platforms used by data teams in 2025.
Snowflake
Snowflake is a cloud-based data platform known for its separate compute and storage architecture, which enables teams to scale workloads independently. It supports SQL querying, semi-structured data (like JSON), and native integrations with major cloud providers, including AWS, Azure, and GCP. Snowflake also offers features like data sharing, secure data collaboration, and native support for materialized views and UDFs.
Snowflake remains a favorite among data teams because of its elastic scalability, ease of setup, and growing ecosystem of AI and ML integrations, making it a top choice for both analytics and real-time experimentation.
Snowflake has seen widespread adoption across industries looking to centralize data and enable cross-team self-service. It’s also a foundational piece in many modern data stacks, often paired with dbt, Fivetran, Secoda, and Looker.
BigQuery
BigQuery is Google Cloud’s fully managed, serverless data warehouse designed for running fast, SQL-based analytics on large datasets. It supports standard SQL, real-time data ingestion via streaming inserts, and seamless integration with other Google Cloud services like Dataflow, Looker, and Vertex AI. BigQuery's architecture automatically handles scaling and performance optimization, removing the need for manual infrastructure tuning.
Its popularity in 2025 comes from its ability to process massive datasets quickly with minimal setup, especially for teams already invested in the Google ecosystem. Many mid-sized tech companies favor it for its pay-as-you-go model and built-in support for machine learning, geospatial analysis, and federated queries across cloud storage.
Amazon Redshift
Amazon Redshift is a fully managed cloud data warehouse by AWS, engineered for petabyte‑scale analytics. It uses Massively Parallel Processing (MPP) and columnar storage to distribute query workloads across multiple nodes, optimizing performance and reducing disk I/O. The service offers both provisioned clusters and a serverless model with auto-scaling capabilities, integrating seamlessly with tools like AWS Glue, Spectrum, and a wide range of BI platforms.
Its appeal in 2025 stems from high-speed query performance, cost flexibility through serverless/reserved options, tight integration within the AWS ecosystem, and strong security/compliance features. As modern data stacks increasingly rely on multi-cloud and hybrid lakehouse architectures, Redshift remains a reliable, scalable foundation for analytics workloads
Databricks
Databricks is a unified lakehouse platform built on Apache Spark that blends the scalability and flexibility of data lakes with the performance and reliability of data warehouses. It enables data engineers to run batch processing, streaming analytics, and machine learning workflows within the same environment and supports open data formats like Delta Lake and Apache Iceberg. The platform also integrates governance tools such as Unity Catalog, AI-led features like Databricks Assistant and Generative AI capabilities (e.g., Mosaic Agent Bricks, Lakebase), and orchestration via Databricks Jobs.
It’s a top choice in 2025 due to its all-in-one architecture that supports AI/ML, real-time analytics, and data engineering at scale without sacrificing performance or governance. Its widespread adoption is evidenced by its estimated $3.7 billion annualized revenue, 60 % year-over-year growth, and strategic partnerships with Anthropic and Google, reinforcing its role as a powerhouse in the data + AI landscape
Firebolt
Firebolt is a next-generation cloud data warehouse built for lightning-fast analytics and ultra-low-latency query performance on terabyte-to-petabyte datasets. It combines decoupled storage and compute, sparse and aggregating indexing, and a vectorized query engine to deliver sub-second responses even under high concurrency. Firebolt’s architecture also supports hybrid deployments with both self-hosted and managed options, especially appealing for teams balancing cloud flexibility with regulatory or performance considerations.
Its popularity in 2025 stems from offering significantly faster query performance at a much lower cost per workload compared to traditional cloud warehouses, making it ideal for real-time dashboards and live data applications.
Users appreciate Firebolt’s ability to support sub-second analytics with high concurrency while integrating seamlessly into existing modern data stacks like dbt, Airflow, and BI tools.
ETL, transformation & ingestion tools
Before you can transform or analyze data, you need to reliably ingest it. These tools extract data from various sources (APIs, databases, SaaS platforms) and load it into your warehouse with minimal setup.
dbt
dbt is an open-source transformation tool that allows data engineers and analysts to write modular SQL to build, test, and document data models within their data warehouse. It enables version-controlled development workflows, automated testing, and lineage tracking, making transformation pipelines more maintainable and transparent. The recent launch of dbt Fusion, along with a VS Code extension, has greatly improved performance (up to 30× faster parsing) and developer productivity .
With its powerful test suite, catalog, and semantic layer features like Metrics API and dbt Canvas, dbt continues to set the industry standard for reliable, governed, and modular data pipelines.
Fivetran
Fivetran is a cloud-native ELT (Extract-Load-Transform) platform that automates the movement of data from a wide range of sources (databases, SaaS apps, files, and event streams) directly into your data warehouse or lake. It features over 600 pre-built connectors, automated schema drift detection, and a connector SDK for building custom integrations without managing infrastructure. Its core strength lies in delivering reliable, maintenance-free pipelines with built‑in governance and data-awareness.
It's especially popular in 2025 because it accelerates time-to-insight by eliminating manual pipeline work, ensuring data integrity, and scaling seamlessly to support AI-ready analytics. Its tight integrations with leading platforms, especially Microsoft Fabric, Databricks, and major warehouses, underscore its position as a go-to solution for centralized, automated data ingestion.
Stitch
Stitch is a cloud-first ETL (Extract‑Transform‑Load) platform designed to simplify data ingestion by moving data from 130+ sources like databases, SaaS apps, and files, into your data warehouse or lake using the Singer open‑source framework. Its intuitive UI and scheduling tools enable reliable, automated pipelines with features like error monitoring, automatic retries, and extraction logs.
It's widely used in 2025 because it accelerates pipeline deployment with minimal coding, supports real-time and batch syncs, and scales easily without custom engineering. Reviews highlight its developer-friendly approach. Adoption spans small teams to enterprise use cases, with users praising its cloud-native, low-maintenance operation and broad data source support.
Airbyte
Airbyte is an open-source, cloud-optional ELT platform built to simplify data ingestion with a developer-friendly design. It supports 600+ connectors, including custom ones via its Connector Development Kit (CDK), and offers both self-managed and hosted options, ensuring flexibility and control over deployment. The platform features an intuitive UI and built-in AI-assisted connector builder that accelerates integration with niche APIs and enterprise systems.
Its rising popularity in 2025 comes from providing the broadest connector coverage with minimal vendor lock-in, offering a low-cost, open-source alternative that’s rapidly releasing new integrations.
Segment
Segment is a customer data platform (CDP) that centralizes behavioral and event data from websites, mobile apps, servers, and other sources. It standardizes and validates incoming data before routing it to destinations like data warehouses, analytics tools, BI platforms, or marketing systems. Through a single tracking API and over 700 connectors, Segment simplifies integration while enforcing consistent schema definitions and quality rules. Segment also supports real-time ingestion and identity resolution to build unified customer profiles.
Its popularity is driven by its ability to eliminate point-to-point integrations and simplify reliable, real-time data ingestion across your stack, accelerating pipeline building and reducing maintenance overhead.
Integrate.io
Integrate.io is a cloud-native low-code/visual ETL and ELT platform that supports automated data flows from over 200 sources, including databases, SaaS applications, CSV/SFTP files, APIs, CDC streams, and destinations like Snowflake, Redshift, and BigQuery. Its drag-and-drop interface allows both data engineers and analysts to build robust pipelines that clean, normalize, and transform data without writing code. The platform also includes built-in features such as schema drift detection, workflow scheduling, error alerts, and AES-256 encryption to maintain security and compliance.
Its strength comes from enabling fast, reliable ingestion and transformation at scale while minimizing engineering overhead. Integrate.io combines reverse ETL, CDC, API generation, and operational dashboarding into a unified product suite, positioning it as a modern alternative to fragmented ingestion and activation tooling systems
Orchestration & workflow management
Once data is flowing into your warehouse, you need a way to automate workflows, schedule jobs, and handle pipeline dependencies. These orchestration tools ensure your data flows reliably and predictably.
Apache Airflow
Apache Airflow is an open‑source workflow management platform that allows you to define, schedule, and monitor data pipelines using Python-based DAGs. Initially developed at Airbnb, it has become a cornerstone in data teams for managing complex ETL and analytics workflows. Version 3.0, released in April 2025, introduced key updates like DAG versioning for reproducible pipeline execution, native event‑driven scheduling, and a React-based UI for enhanced operational visibility.
Airflow stands out for its robust scheduling, extensibility via rich provider plugins, and mission-critical reliability across thousands of workflows, making it the de facto orchestration tool in enterprise data stacks.
Prefect
Prefect is an open‑source, Python-native orchestration tool that enables flexible workflow automation, monitoring, and error handling using a modern task-first API. It integrates smoothly with data transformation tools like dbt and frameworks like Pandas or Spark, and allows for defining tasks and flows in a highly modular way. Prefect’s hybrid execution model and its dynamic DAG engine let teams react to real-time conditions, including event triggers and scaling needs, without breaking workflow logic.
Prefect is favored by teams because it offers developer-first transparency, built-in observability, and self-service orchestration that scales from experiment to production.
Dagster
Dagster is an open-source orchestration platform purpose-built for data engineering, offering a declarative Python API and a strong focus on data-aware pipeline development. Unlike traditional DAG schedulers, Dagster models pipelines around assets (like tables or files), enabling clear visibility into dependencies, freshness, and lineage. It comes with built-in observability, typed I/O, software-defined assets (SDAs), and native integrations with tools like dbt, Snowflake, and Spark.
A core benefit is that it embeds data quality, metadata visibility, and versionable pipelines directly into orchestration, reducing friction between engineering and governance. Dagster is increasingly adopted by teams looking to accelerate delivery, improve reliability, and seamlessly track data lineage and costs across complex stacks.
Stream & batch processing engines
These tools allow you to process large volumes of data, either in real time (streaming) or in scheduled jobs (batch). Essential for teams handling event data, log processing, or time-sensitive use cases.
Apache Spark
Apache Spark is an open‑source, distributed analytics engine built for high‑performance batch and streaming workloads across large datasets. It supports in‑memory computing and a unified API (DataFrames, Spark SQL, MLlib, and Structured Streaming) across multiple languages like Python, Java, Scala, and R, making it flexible for diverse workflows. Spark’s Structured Streaming enables near‑real-time data processing by automatically applying batch logic to incoming data streams. It also integrates with cloud services like Databricks, AWS EMR, and GCP Dataproc to support large‑scale deployments.
Its versatility and unmatched ecosystem allows teams to run batch ETL, machine learning, and stream processing from a single platform, effortlessly scaling pipelines for analytics and AI workloads.
Apache Flink
Apache Flink is a powerful open‑source engine for true streaming and unified batch processing, offering event-time semantics, exactly‑once consistency, and low-latency stateful operations. With the release of Flink 2.0 (March 2025), Flink introduces disaggregated state storage, materialized table support, and improved batch capabilities, making it ideal for streaming lakehouse architectures and large-scale data systems. It provides rich APIs for Java, Python, and SQL, and integrates deeply with message queues (like Kafka and Kinesis), data lakes, and AI inference workflows.
Flink is increasingly favored by organizations that need real-time analytics, low-latency decision making, and unified stream-batch execution.
Apache Beam
Apache Beam is an open-source unified programming model for both batch and streaming data processing pipelines. It lets engineers define their data workflows using a single API in Java, Python, or Go and execute them on various runners such as Apache Flink, Apache Spark, or Google Cloud Dataflow. Beam’s unified model simplifies pipeline development and maintenance by collapsing batch and streaming logic into one coherent framework.
It allows teams to write once and run anywhere, delivering maximum flexibility and reuse across diverse runtime environments while reducing pipeline divergence. This makes Beam a compelling choice for organizations aiming to reduce vendor lock-in and streamline ETL code maintenance.
Apache Kafka
Apache Kafka is an open-source distributed event streaming platform designed for high-throughput, low-latency data pipelines and stream processing. It serves as the backbone of many modern real-time architectures, providing durable storage, fault tolerance, and scalable messaging via topics and partitions. Kafka also includes Kafka Connect for integrating with data sources and sinks, and Kafka Streams or ksqlDB for lightweight stream processing within the cluster ecosystem.
Kafka continues to be a critical part of the modern data stack, powering real-time data pipelines and microservice communication. With Version 4.0, new features like KRaft mode and Queues for Kafka make it easier to scale and manage, eliminating the need for Zookeeper and reducing operational complexity. This allows data teams to spend less time on infrastructure and more time building reliable, real-time ingestion workflows.
Data quality & version control
Data engineers are increasingly expected to own data quality and lineage. These tools help you validate, document, and even version datasets, just like developers version code.
Great Expectations
Great Expectations is an open-source Python framework designed for automating data validation and quality checks within pipelines. It lets teams define expectations (rules) about data, like missing values, range limits, and schema consistency, and apply them across batch or streaming workflows. It integrates seamlessly with orchestration tools, BI platforms, and data stores such as Pandas, Spark, SQL warehouses, and more. The platform also generates human-readable reports and dashboards so teams can monitor data quality trends over time.
It remains popular because it enables engineers to automate quality assurance and institutionalize data expectations, significantly reducing downstream errors and improving trust in downstream stakeholders.
lakeFS
lakeFS is an open-source data version control system that brings Git-like operations (branching, committing, merging, rollback) to object storage systems like S3, GCS, or Azure Blob. Data teams can use branches to experiment with new pipelines or transformations without copying large datasets; changes can later be merged or discarded atomically. lakeFS integrates with tools and orchestration platforms like Apache Spark, Airflow, dbt, and Dagster, enabling CI/CD workflows for data and full auditability across pipeline stages.
It gives teams control over dataset states, enables reproducible experimentation, and improves governance through immutable, auditable histories, all with minimal operational overhead.
DVC (Data Version Control)
DVC is an open-source tool that brings Git-style versioning to large datasets, ML models, and pipeline definitions, while storing the actual data in external storage like S3, GCS, or Azure Blob. It tracks data and experiments via lightweight metadata files and lets users define reproducible workflows using dvc.yaml stages, all integrated with Git for seamless CI/CD workflows. The release of DVC 3.0 in early 2025 introduces features like distributed storage, agent metadata tracking, and parallel transfers for managing large-scale AI workflows with better performance and versioning support.
DVC stands out because it enables transparent experiment tracking, versionable datasets, and model lineage alongside code, all without overwhelming Git with large files. It supports reproducibility, collaboration, and data governance across AI and data science teams.
Business intelligence & visualization
Once the data is processed and modeled, it’s time to make it useful for business users. These BI tools help analysts and decision-makers visualize, explore, and interact with the data.
Looker
Looker is a cloud-native BI platform built around a centralized semantic layer called LookML, which encapsulates dimensions, measures, and data relationships to ensure consistency across dashboards and reports. It connects directly to SQL databases and cloud warehouses, running live queries to avoid data duplication and ensure up-to-date insights. Looker's UI supports both technical users via SQL exploration and non-technical users through click-based filtering and visualization.
Looker remains favored for its governance-first model and live analytics, delivering trusted, up-to-date reporting across entire organizations while incorporating AI features like conversational analytics and formula generation powered by Google’s Gemini models.

Lineage in Secoda shows a Snowflake table, its upstream views, being transformed by dbt, and visualized in Tableau and Looker.
Sigma Computing
Sigma Computing offers a spreadsheet-style BI interface directly on cloud data warehouses, allowing business users to perform analysis using formulas, pivot tables, and visual exploration, all without writing code. While it's easy for analysts, it scales with enterprise needs through role-based access controls, version history, and integration with dbt and other data stack tools. It excels at threaded collaboration and live dashboards based on warehouse queries.
It delivers a spreadsheet familiar UX with built-in governance and direct SQL access, making it ideal for scaling analytics teams without sacrificing consistency or trust across dashboards.
Hex
Hex is a collaborative data notebook platform that combines SQL and Python for interactive data exploration and dashboarding. It supports real-time collaboration, version control for notebooks, and applications built from data logic, all chained together with visual storytelling and data sharing features.
Hex stands out for its notebook-first approach to BI, enabling analysts and engineers to build interactive dashboards and workflows in a shared environment.
Omni
Omni is a next-gen, direct-query BI platform designed for business users, combining point-and-click ease, spreadsheet-like logic, and SQL capabilities in one interface. Built on a semantic layer that enforces consistent metrics and definitions, it supports Excel-style formulas, AI assistants, and seamless dbt integration for metric governance and developer workflows.
It balances self-service analytics with enterprise governance, enabling non-technical users to explore data confidently while maintaining model consistency and developer-grade assurance across dashboards.
Tableau
Tableau is a mature, visual-analytics platform known for rich interactivity and drag-and-drop dashboard building. It supports live and extract connections to many data sources and offers deep customization, storyboarding, and advanced chart types across teams.
Tableau continues to deliver enterprise-grade visualization with advanced storytelling and BI governance, especially for teams that prioritize interactive dashboards and broad adoption across non-technical users.
Power BI
Microsoft Power BI is a cloud-based BI and reporting platform integrated into the Microsoft ecosystem, enabling users to build rich dashboards via drag-and-drop visuals, natural language querying (Copilot), and AI-generated insights. It's tightly integrated with tools like Excel, Azure Synapse, and Microsoft Fabric for unified analytics across Microsoft’s stack.
Power BI is popular due to its familiar interface, broad accessibility, and seamless integration with Microsoft tools, making it a cost-effective choice for companies already invested in the Microsoft ecosystem.
What should you look for when choosing data engineering tools?
Picking the right tools for your data stack isn’t just about checking feature boxes. It’s about making sure those tools actually fit how your team works today and how you’ll scale in the future. Here are some things to keep in mind:
- Scalability: Make sure the tool can handle your current data volume and grow with you. It should support everything from lightweight datasets to complex, enterprise-scale workloads.
- Ease of integration: The smoother it fits into your existing setup, whether that’s your warehouse, orchestration platform, or BI tool, the less friction you’ll run into. Compatibility with cloud providers and popular frameworks is key.
- Automation: Look for tools that handle tasks like ingestion, transformation, or error handling automatically. The less manual work involved, the more time your team can spend on strategy and analysis.
- Security and compliance: It’s important to choose tools that follow best practices for security and meet any compliance standards you’re responsible for, such as GDPR or HIPAA.
- Support for real-time processing: Depending on your use case, support for both batch and real-time data pipelines might be essential. This is especially important if you're delivering insights on the fly or supporting operational decision-making.
- Flexibility: Your use cases will change. Tools that let you customize workflows, build your own logic, or extend functionality with APIs are more likely to keep up with your team’s evolving needs.
- Cost alignment: Pricing models should match your data usage and team size. Pay attention to whether pricing scales predictably, especially for cloud-based or usage-based tools.
- Ease of use: Tools with clean, intuitive interfaces help your whole team work faster. Bonus points if non-technical users can get value without heavy onboarding or training.
- Support and community: Reliable documentation, active community forums, and responsive support can make a big difference when you’re troubleshooting or trying something new.
- Data governance and lineage: Strong lineage, documentation, and metadata tracking help build trust in the data. This is especially important as more teams across the org start relying on what your pipelines deliver.
Keeping these in mind will help you build a data stack that’s reliable today and still works when things get more complex down the road.
What’s next in Data Engineering?
The role of data engineering is evolving. After solving foundational challenges like warehousing, scalable ETL, and data quality, teams are moving toward higher-value goals: defining shared metrics, aligning stakeholders, and enabling faster, more confident decisions across the business.
This shift mirrors the structure of the Analytics Hierarchy of Needs, a framework introduced by Ryan Foley that outlines how organizations mature in their use of data. Here's how teams are advancing, and where leading data engineers are focusing their efforts:

1. Data collection and warehousing
This is the foundation. Organizing and storing data in platforms like Snowflake, BigQuery, and Redshift creates a centralized starting point for analysis. But many organizations stop here, capturing data without adding structure or context.
2. Transformation and cleaning
Once the data is collected, the next step is preparing it for use. Tools like dbt and Spark help teams clean, normalize, and transform datasets. With the rise of ELT, transformations now happen inside the warehouse, making the process faster and easier to govern.
3. Defining metrics and building shared models
This is where things often break down. Even with clean data, inconsistent definitions across teams can lead to confusion. Tools like Secoda help solve this by documenting assets, aligning teams on metric definitions, and making ownership clear. When teams define data the same way, trust and clarity follow.
4. Driving insights and analysis
Once data is modeled and aligned, business users can explore it confidently. Data engineers play a key role in enabling this access by building infrastructure that prioritizes speed, transparency, and usability. The result is deeper insights and fewer dependencies on the data team for every request.
5. Enabling predictive and prescriptive analytics
At the top of the hierarchy is forward-looking value. Teams use AI and machine learning to power decision-making, forecasting, personalization, and automation. But none of that works without trustworthy data. High-performing teams invest in the infrastructure to feed models with reliable, high-quality inputs.
Solving the communication gap in data
Once teams have reliable pipelines and clean data, a new challenge tends to emerge: getting everyone on the same page about what the data actually means. The problem usually isn’t technical, but a communication issue. Definitions live in spreadsheets, tribal knowledge, or scattered dashboards, and teams spend too much time trying to align on metrics that should already be standardized.
Take something as simple as “rides per week.”
- The data team defines it as rides completed between January 1 and January 7.
- The marketing team counts rides started in that same window.
- The sales team looks at riders who paid between January 1 at 7:00 AM and January 8 at 6:59 AM.
Each definition is valid, but the lack of visibility leads to confusion, misalignment, and back-and-forth meetings that stall progress. This is what we refer to as data debt, not a lack of data, but a lack of shared understanding around it.
We believe solving this is the next frontier for data engineering.
Teams need a single place to document, define, and discover data together, not just to reduce confusion, but to move faster. That’s where Secoda fits in. Our platform helps teams centralize definitions, track ownership, and surface context automatically, so data isn’t just accessible, it’s understandable.
As organizations adopt the modern data stack, solving the communication gap will be just as important as building the right pipelines. We’re building Secoda to make that collaboration possible.

How does Secoda support data engineering teams?
Data engineers are expected to do more than just build and maintain pipelines. They’re responsible for ensuring data is trustworthy, discoverable, and usable across the organization. But too often, engineers end up answering the same questions repeatedly, digging through Slack threads, or maintaining outdated documentation.
Secoda is built to change that.
By centralizing documentation, ownership, lineage, and data quality in one place, Secoda gives engineers the context they need, without slowing them down. Instead of maintaining scattered resources or answering ad hoc questions, teams can build structured, scalable systems that support the entire company.
Here’s how Secoda helps data engineering teams:
- Fewer repetitive questions: With auto-generated documentation, column-level lineage, and shared definitions, teams can answer common questions once, and let others self-serve from there.
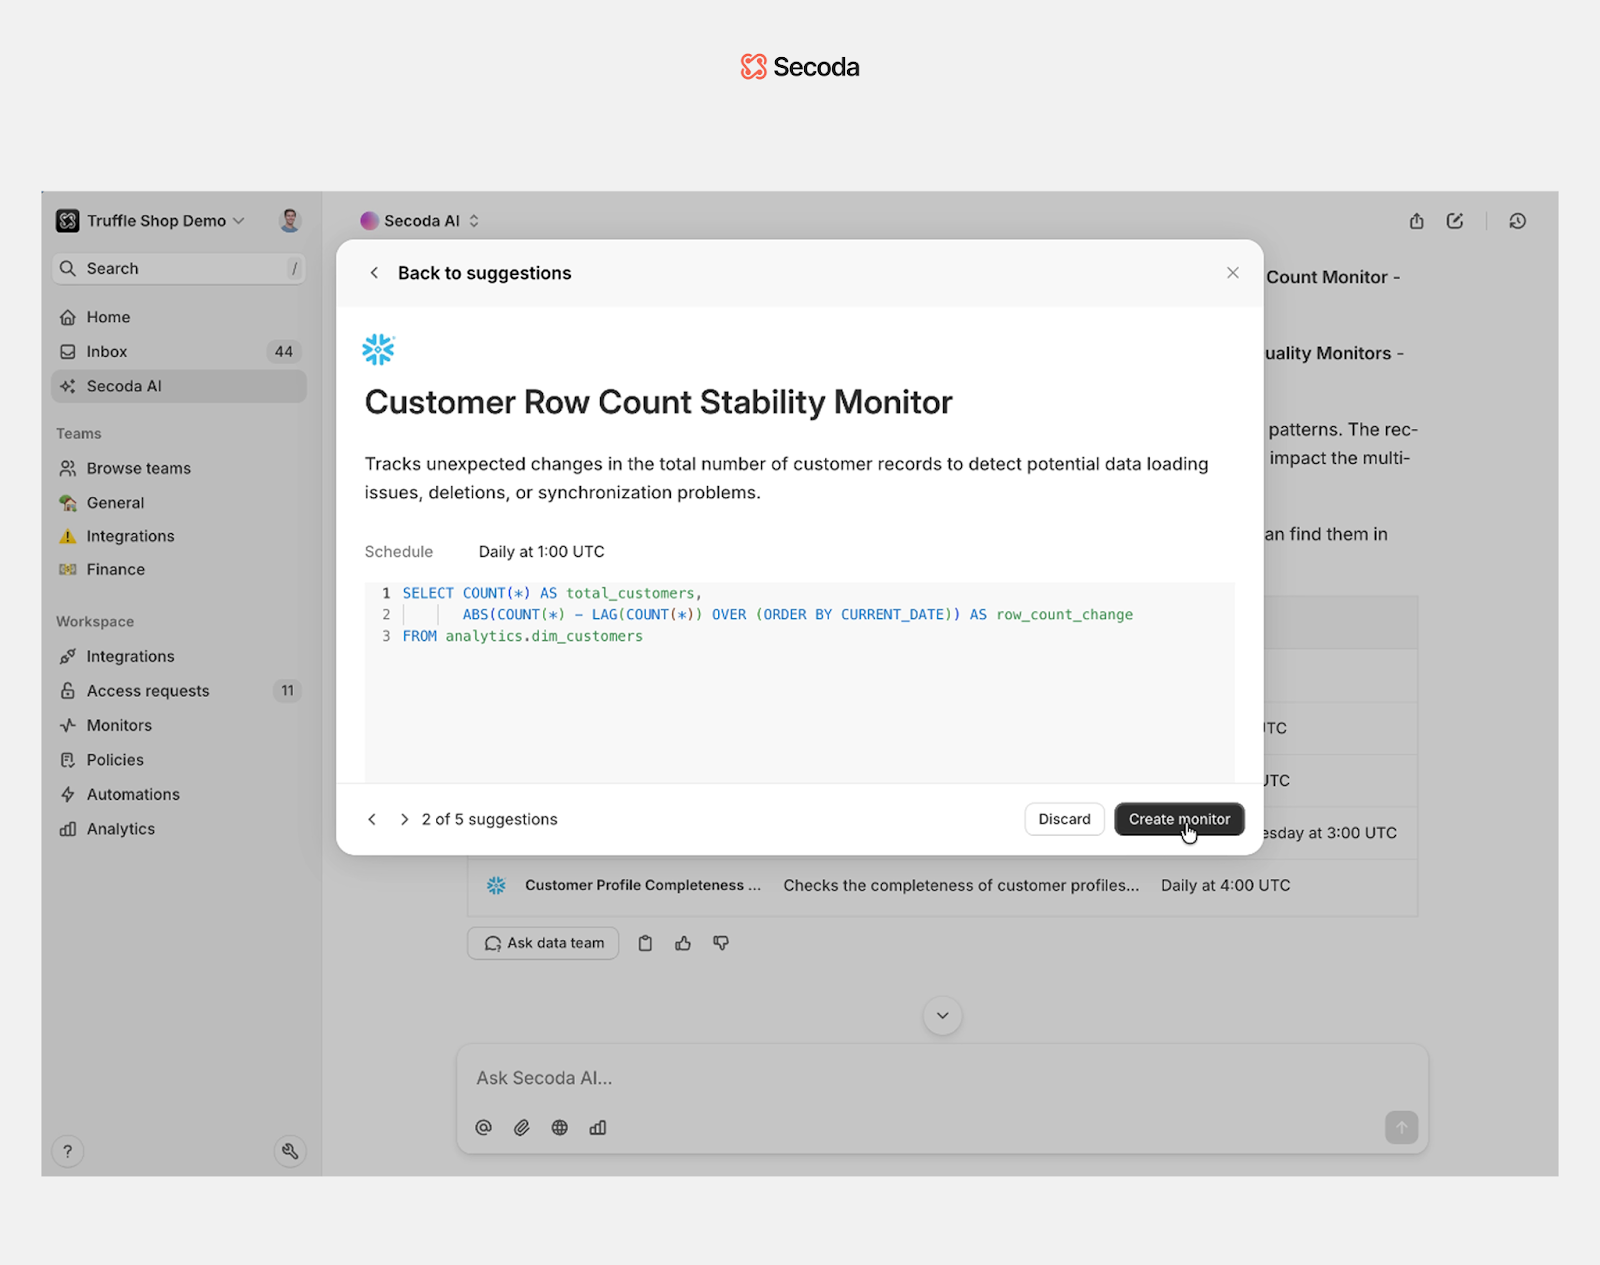
- More confidence in the data: Data quality scores, tests, and monitors make it easier to identify and fix issues before they hit dashboards. Engineers can catch problems early and communicate status clearly.
- Faster onboarding and ramp-up: New team members can quickly get up to speed with centralized knowledge, past questions, and clear documentation of how data works and who owns what.
- Stronger alignment with stakeholders: Shared glossaries, usage insights, and tracked ownership help reduce confusion and ensure teams are aligned on the metrics that matter.
- Support for modern workflows: Secoda integrates with tools like dbt, Snowflake, Looker, and 70+ more, bringing context directly into the tools teams already use.
- Ask anything with Secoda AI: By pulling in metadata from across your stack, Secoda AI enables teams to ask natural language questions about tables, columns, metrics, lineage, observability, and more, without needing to dig through documentation manually.
Conclusion
Data engineering has grown into one of the most cross-functional and strategic roles in modern organizations. Today’s teams are responsible not just for building pipelines but for shaping how data is defined, trusted, and used across the business. As the stack expands, the need for scalable, transparent, and collaborative tooling becomes even more critical.
This updated list of 27 tools reflects where the industry is heading:
- Warehouses and lakehouses like Snowflake, Redshift, BigQuery, and Databricks offer scalability, fast querying, and native compute for modern analytics.
- Transformation and orchestration tools like dbt, Airflow, Prefect, and Dagster help teams build structured, observable pipelines that scale with complexity.
- Streaming and real-time platforms such as Flink, Kafka, Beam, and Spark power time-sensitive workflows and event-driven architectures.
- Data quality, version control, and governance solutions like lakeFS, great_expectations, DVC, and Secoda help teams manage change, reduce data debt, and collaborate with confidence.
- Visualization and semantic tools like Looker, Tableau, Sigma, Power BI, Hex, and Omni enable both technical and non-technical users to explore and act on data.
- Ingestion tools like Fivetran, Airbyte, Stitch, Segment, and Integrate.io accelerate the movement of data while reducing manual work.
Choosing the right combination of tools is just the beginning. What matters next is how well those tools work together and how easily your team can share context, define metrics, and resolve issues before they impact the business.
That’s where Secoda comes in. If you're looking to centralize documentation, improve data quality, and make it easier for teams to find and trust the right data, try Secoda for free. It’s built to help data engineers scale their impact without scaling overhead.
The next wave of data engineering is about alignment, clarity, and speed. The right tools will help. The right system will make it sustainable.
.png)
.png)


